简体中文
繁體中文
English
Pусский
日本語
ภาษาไทย
Tiếng Việt
Bahasa Indonesia
Español
हिन्दी
Filippiiniläinen
Français
Deutsch
Português
Türkçe
한국어
العربية
KVB Market Analysis | 20 September: Gold Surges as Fed Cuts Rates by 50 bps, Eyes $2,600 Mark
Sommario:Product: XAU/USDPrediction: IncreaseFundamental Analysis:Gold prices advanced on Thursday after the Federal Reserve (Fed) embarked on an easing cycle with a 50-basis-point (bps) rate cut. Traders igno
Product: XAU/USD
Prediction: Increase
Fundamental Analysis:
Gold prices advanced on Thursday after the Federal Reserve (Fed) embarked on an easing cycle with a 50-basis-point (bps) rate cut. Traders ignored the rise of US Treasury yields, which correlate inversely to the non-yielding metal, which remains on its way toward reclaiming $2,600. At the time of writing, XAU/USD trades at $2,589, up over 1%. Following the Fed's decision, bullion prices extended their gains after registering losses on Wednesday. Officials side with the larger of two cuts expected by Wall Street, justifying their decision by pointing to inflation moving sustainably toward the Feds 2% goal. Fed Chair Jerome Powell stressed that the Fed could maintain labor strength with policy adjustments.
Technical Analysis:
Gold price uptrend remains intact, but after Wednesdays Shooting Star candlestick pattern, buyers must challenge the year-to-date peak of $2,599 if they would like to stay hopeful of conquering the $2,600 mark. Momentum favors buyers. The Relative Strength Index (RSI) aims upwards in bullish territory and not in overbought territory. Therefore, the path of least resistance is tilted to the upside. XAU/USD's first resistance would be $2,599, followed by $2,600. On further strength, buyers can challenge the psychological levels of $2,650 and $2,700. If XAU/USD drops below the September 13 low of $2,556, the next support would be $2,550. Once cleared, the next stop would be the August 20 high, which turned into support at $2,531, before aiming toward the September 6 low of $2,485.

Product:XAG/USD
Prediction: Increase
Fundamental Analysis:
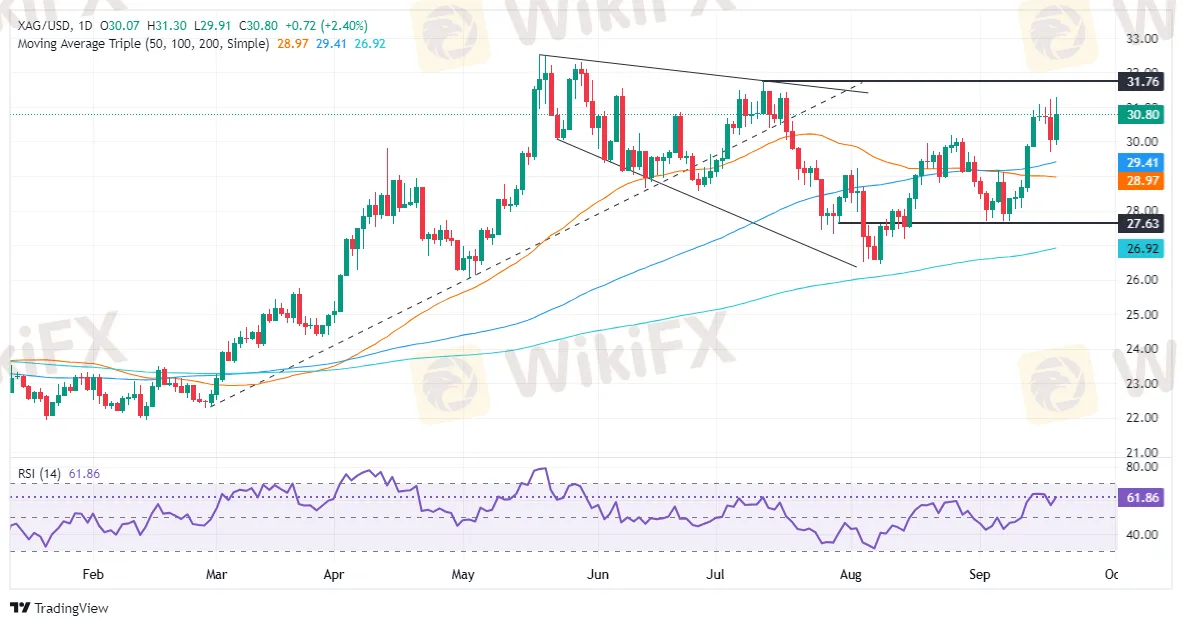
Silver climbed sharply during Thursdays North American session, printing solid gains of over 2%, and closed at around $30.77. Investors, seeking risk and ditching the US Dollar, cheered the Federal Reserve's rate cut. Market sentiment remains upbeat, with Wall Street's main index, the S&P 500, climbing to a record high. Meanwhile, the precious metals segment, led by Gold and Silver, surged sharply while the Greenback dropped over 0.30%, according to the US Dollar Index (DXY) at 100.63.
Technical Analysis:
Silver price is threatening to decisively clear a downslope resistance trendline drawn from May 20 highs passing through $30.67. If this trendline is broken decisively, it will open the way to challenging $31.00. In that outcome, XAG/USD next resistance will be the July 11 swing high at $31.75, followed by the May 29 peak at $32.29. On further strength, the year-to-date (YTD) high at $32.51 will be up for grabs. Conversely, bears would need to push the greys metal price below the September 18 swing low of $29.71, ahead of testing the 100-day moving average (DMA) at $29.43

Product: USD/JPY
Prediction: Decrease
Fundamental Analysis:
The Japanese Yen (JPY) edges lower against the US Dollar (USD) following the National Consumer Price Index (CPI) data released on Friday. Traders are now focusing on the Bank of Japan (BoJ) policy decision later in the day, with expectations of keeping its short-term interest rate target between 0.15% and 0.25%. Japan's Consumer Price Index (CPI) increased to 3.0% year-on-year in August, up from 2.8% previously, marking the highest level since October 2023. Additionally, the Core National CPI, excluding fresh food, reached a six-month high of 2.8%, rising for the fourth consecutive month and in line with market expectations.
Technical Analysis:
USD/JPY trades around 142.30 on Friday. Analysis of the daily chart indicates that the pair is consolidating within a descending channel, which supports a bearish bias. However, the 14-day Relative Strength Index (RSI) remains below the 50 level, confirming an ongoing bearish outlook. On the downside, the USD/JPY pair might find immediate support at 139.58, which is the lowest level since June 2023, followed by the lower boundary of the descending channel near 137.50. On the resistance side, the 21-day Exponential Moving Average (EMA) at the 143.56 level acts as an initial barrier, followed by the upper boundary of the descending channel around the 144.80 level.

Disclaimer:
Le opinioni di questo articolo rappresentano solo le opinioni personali dell’autore e non costituiscono consulenza in materia di investimenti per questa piattaforma. La piattaforma non garantisce l’accuratezza, la completezza e la tempestività delle informazioni relative all’articolo, né è responsabile delle perdite causate dall’uso o dall’affidamento delle informazioni relative all’articolo.
WikiFX Trader
FOREX.com
STARTRADER
Tickmill
OANDA
Vantage
XM
FOREX.com
STARTRADER
Tickmill
OANDA
Vantage
XM
WikiFX Trader
FOREX.com
STARTRADER
Tickmill
OANDA
Vantage
XM
FOREX.com
STARTRADER
Tickmill
OANDA
Vantage
XM
Rate Calc


