简体中文
繁體中文
English
Pусский
日本語
ภาษาไทย
Tiếng Việt
Bahasa Indonesia
Español
हिन्दी
Filippiiniläinen
Français
Deutsch
Português
Türkçe
한국어
العربية
How to Use Moving Averages in Forex Market
Abstract:Identifying the direction of the market trend is key to trading any financial markets, not just the forex market.

Traders and technical analysts have different ways of determining the trend direction, but moving averages perhaps are one of the the most popular technical indicators due to its easy-to-use nature and multitude of uses when trading. The moving average itself may also be the most important indicator, as it serves as the foundation of countless others, such as the Moving Average Convergence Divergence (MACD).
In this article, we will introduce what the indicator means, the various types and show you the different ways to use moving averages in your trading.
Definition of Moving Average
The moving average (MA) is an average of specific price data over a specified period, and since the price is continuously moving and generating new data, the average is also changing continuously — hence, the name moving average.
On chart, the MA is a line that follows the trend, giving you an idea of which way the market is moving. The Moving Average is a lagging indicator meaning it follows the trend. It is often used in conjunction with other indicators to give you an indicator or when to trade or when a trend is about to reverse.
There are a few different types of Moving Averages and amongst them the most famous ones are:
1. Simple Moving Average (SMA)
The SMA is a basic average of price over the specified timeframe. For example, if one plots a 50-period SMA onto a chart, it will add up the previous 50 closing prices and divide by the number of periods (50) in order to determine what the current value of the SMA should be. The series of various points are joined together to form a line.
Price tends to be above moving averages in uptrends as various lower prices will be baked into the reading from earlier in the trend. For the same reasons, in a downtrend, the moving average will be negatively sloped and price will be below the moving average.
2. Exponential Moving Average (EMA)
An Exponential Moving Average is a variation of moving averages- one that gives more weighing to recent data as opposed to all data.
Since the Exponential Moving Average gives more weight to recent data, it is more sensitive to the recent price moves. Thus, for the same period, the EMA line is closer to the price bars than the SMA line.
3. Weighted Moving Average (WMA)
The weighted moving average (WMA) gives you a weighted average of recent prices, where the weighting decreases with each previous price. This works similarly to the EMA, but you calculate the WMA differently.
You can customize the weighted moving average more than the SMA and EMA. The most recent price points are usually given more weight. It could also work the other way, where you give historical prices more weight.
Trading with Moving Averages
1. Trading with one MA
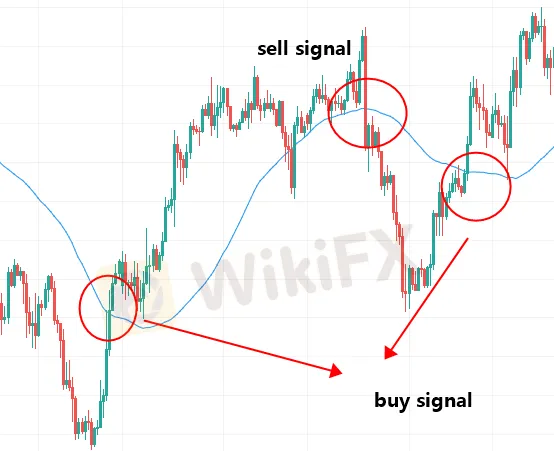
This is the most basic and universal approach. Since only one indicator is needed for the analysis, the position should be open when the price crosses the MA: If the price crosses MA upwards, a long position opens. If the price crosses MA downwards, its best to sell.

AS the chart above, when the price crosses the 50 MA upwards, it signifies a buy signal. When the price crosses the 50 MA downwards, it signifies a sell signal.
One of the strategys shortcomings is that there are many false signals. One MA can help catch a major trend, but before that, you might have to open several losing positions. That is why you have to set a stop loss for each position and allow the profit to grow, thus compensating for the previous losses.
2. Trading with two moving averages
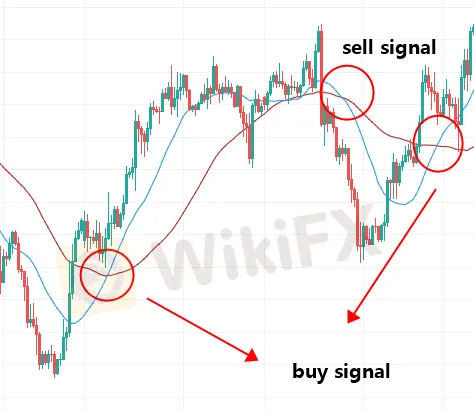
This approach is similar to the previous one, but here the chart has two MAs with different time parameters. The signal will be the intersection of the two MAs. For example, we use the 20-day moving average and the 50-day moving average to illustrate the trading strategy:

As we can see from the chart above, the red line represents the 50-day moving average and the blue line represents the 20-day moving average, which is generally regarded as an important short-term technical indicator. Upward momentum is confirmed with a bullish crossover, which occurs when a short-term moving average crosses above a longer-term moving average. Conversely, downward momentum is confirmed with a bearish crossover, which occurs when a short-term moving average crosses below a longer-term moving average.
3. Using moving averages with indicators
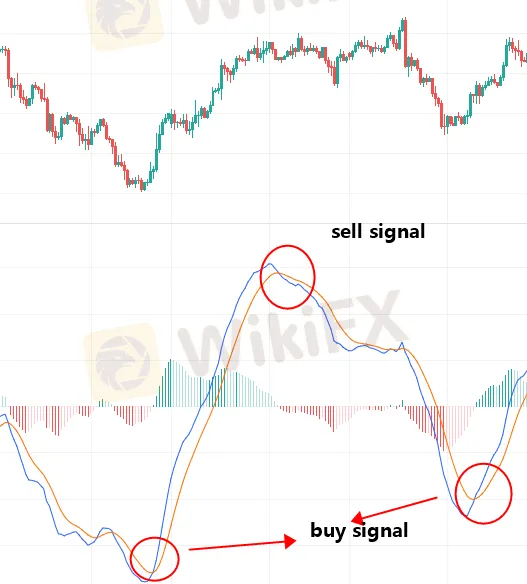
The use of moving averages in combination with indicators is widespread. In fact, there are a few popular indicators that are used in conjunction with moving averages. Amongst the most popular ones are: RSI, MACD and Bollinger Bands.
For example, we use MA+MACD strategy to make the trading decision. MACD is an oscillator that uses the data on two MAs and their interactions.

Moving averages are about the most commonly used indicator among financial market traders — both price action traders and indicator followers use it. A lot of things you can do with moving averages — study them and formulate a strategy that suits you.
There are pros and cons and one needs to consider them all when trading with moving averages. You should test different combinations of moving average crossovers and then choose the one that fits your needs. You should also test different instruments and timeframes and see which one best fits your personality.

Disclaimer:
The views in this article only represent the author's personal views, and do not constitute investment advice on this platform. This platform does not guarantee the accuracy, completeness and timeliness of the information in the article, and will not be liable for any loss caused by the use of or reliance on the information in the article.
Read more

WikiEXPO Dubai 2024 will take place soon!
2 Days Left!

Italian Regulator Warns Against 5 Websites
The Italian regulator, CONSOB has issued a warning against five websites offering unauthorized financial services. This regulatory action aims to protect the public from fraudulent activities.

WikiEXPO Dubai 2024 is coming soon
3 Days Left!

Trader Exposes Unethical Practices by STP Trading
A recent allegation against STP Trading has cast doubt on the firm's business practices, highlighting the potential risks faced by retail traders in an increasingly crowded and competitive market.
WikiFX Broker
Latest News
Hackers Charged for $11M Crypto Theft Using SIM-Swaps
Role of Central Banks in the FX Market
FCA Alerts Against Sydney FX
What Makes Cross-Border Payments Easier Than Ever?
Trader Exposes Unethical Practices by STP Trading
Malaysian Man Loses RM113,000 in Foreign Currency Investment Scam
Bitcoin Nears $100,000: A Triumph of Optimism or a Warning Sign?
Mastercard Partners with JPMorgan for B2B Cross-Border Payments
FCA Identifies Clone Firm Exploiting Admiral Markets' Credibility
Coinbase Under Scrutiny Amid Wrapped Bitcoin Delisting Controversy
Currency Calculator


