简体中文
繁體中文
English
Pусский
日本語
ภาษาไทย
Tiếng Việt
Bahasa Indonesia
Español
हिन्दी
Filippiiniläinen
Français
Deutsch
Português
Türkçe
한국어
العربية
Ethereum price faces further danger as bearish pattern projects 16% decline
Abstract:Ethereum price could be at risk of another 16% fall projected by the governing technical pattern.

The lower boundary of the prevailing chart pattern may act as reliable support for ETH at $2,477.
However, Ethereum could tumble toward $2,100 if the token slices below the critical foothold.
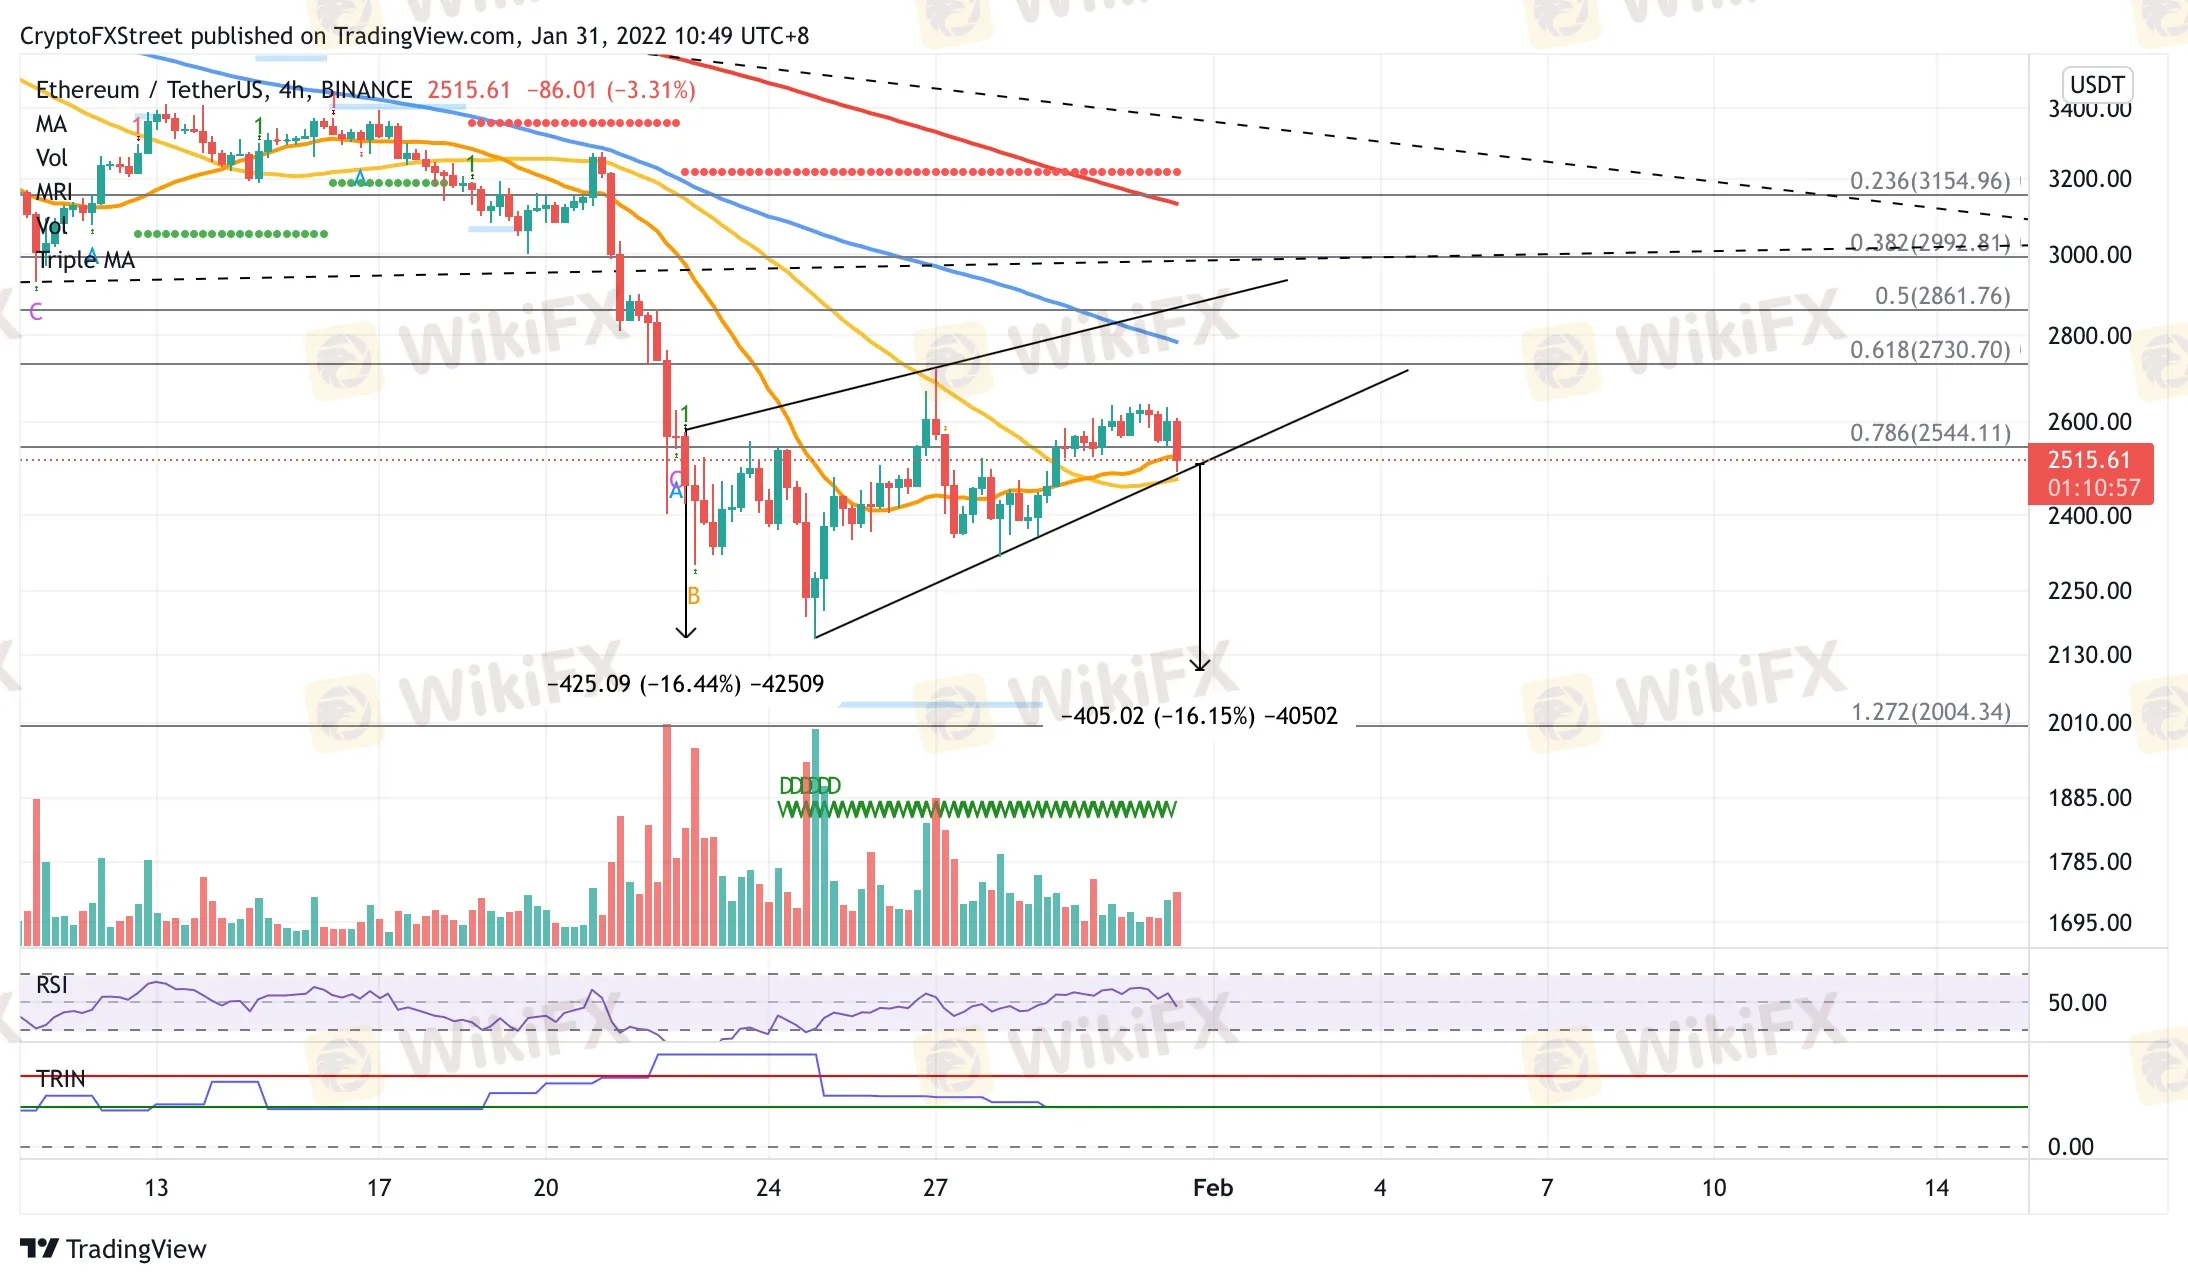
Ethereum price is not out of the woods yet as the second-largest cryptocurrency by market capitalization has formed a cautious outlook. The prevailing chart pattern projects a 16% drop if the token slices below $2,477.
Ethereum price continues to look bearish
Ethereum price has formed a rising wedge pattern on the 4-hour chart, indicating that ETH could be at risk of a 16% decline toward $2,100 if it slices below the lower boundary of the governing technical pattern at $2,477.
ETH is grasping for support at the 21 four-hour Simple Moving Average (SMA) at $2,510. Ethereum price will discover reliable support at the 50 four-hour SMA at $2,477, which intersects with the lower boundary of the prevailing chart pattern.
If Ethereum price slices below the aforementioned line of defense, then ETH would be vulnerable to further decline, a 16% fall toward $2,100.
If selling pressure continues to increase, the January 27 low at $2,349 may act as a foothold for Ethereum price, then at the January 25 low at $2,221.
Ethereum price may tumble further toward the pessimistic target at $2,100 if the bulls refuse to step in.

However, if a spike in buy order occurs, Ethereum price may face the first line of resistance at the 78.6% Fibonacci retracement level at $2,544, then at the 61.8% Fibonacci retracement level at $2,730, coinciding with the January 27 high.
Additional obstacles for the bulls may emerge at the 100 four-hour SMA at $2,783, then at the upper boundary of the governing technical pattern at $2,861, intersecting with the 50% retracement level.
Bigger aspirations may target the 38.2% Fibonacci retracement level at $2,992.

Disclaimer:
The views in this article only represent the author's personal views, and do not constitute investment advice on this platform. This platform does not guarantee the accuracy, completeness and timeliness of the information in the article, and will not be liable for any loss caused by the use of or reliance on the information in the article.
Read more

WikiEXPO Dubai 2024 will take place soon!
2 Days Left!

WikiEXPO Dubai 2024 is coming soon
3 Days Left!

WikiEXPO Dubai 2024 is set to open!
4 Days Left

7 Days Left!WikiEXPO Dubai 2024 is about to make a stunning debut!
Seeing Diversity Trading Safely
WikiFX Broker
Latest News
What Makes Cross-Border Payments Easier Than Ever?
Trader Exposes Unethical Practices by STP Trading
Italian Regulator Warns Against 5 Websites
Currency Calculator


